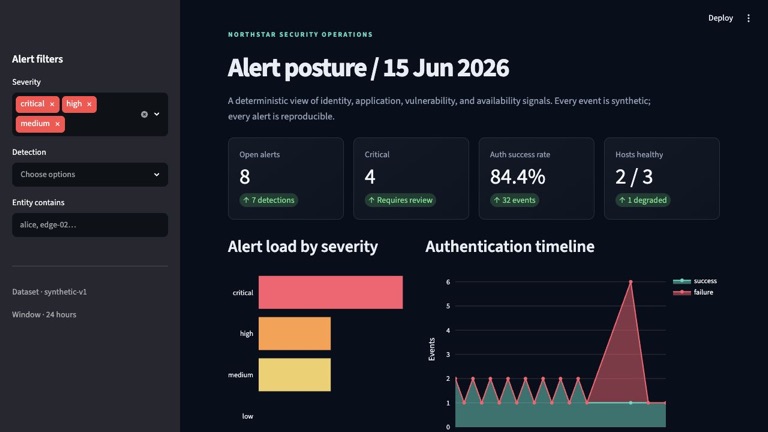
A local security-operations dashboard that generates synthetic telemetry, evaluates YAML-defined detections, supports alert investigation, and exports an incident summary.
This page documents a later portfolio reconstruction of a project originally completed during the ASU Cybersecurity Boot Camp in 2020. The current code, data, screenshots, and reports are not the untouched original submission.
ASU Cybersecurity Boot Camp · 2020Reviewed July 2026
This current lab uses a fixed synthetic dataset to revisit the SOC analysis practiced in the original bootcamp project.
For
Recruiters and technical reviewers evaluating how deterministic synthetic telemetry, detection logic, alert triage, and supporting evidence are presented in a local learning system.
Role
Original bootcamp project work; later data model, detection rules, dashboard implementation, investigation flow, and documentation
Build
Later portfolio reconstruction of an original bootcamp project
The problem
Why this needed to exist.
A useful SOC demonstration needs more than charts: the detection logic, generated events, alert queue, evidence, and analyst guidance should all be inspectable without requiring a commercial SIEM.
Defining decision
Use a fixed synthetic dataset and portable rule definitions so every displayed alert can be traced to known inputs and inspectable detection logic.
Approach
How the system was shaped.
Defined each rule with an identifier, description, severity, source fields, threshold, time window, and analyst note.
Connected overview metrics and charts to a filterable alert queue and evidence-level detail.
Kept all executable paths local and generated every displayed event from a fixed synthetic dataset.
Tradeoffs
What the design chooses—and gives up.
Portable YAML rules and local data make the demonstration reproducible while omitting production ingestion, scaling, and case-management concerns.
Evidence
What can be inspected.
The fixed dataset yields eight alerts from seven detection definitions.
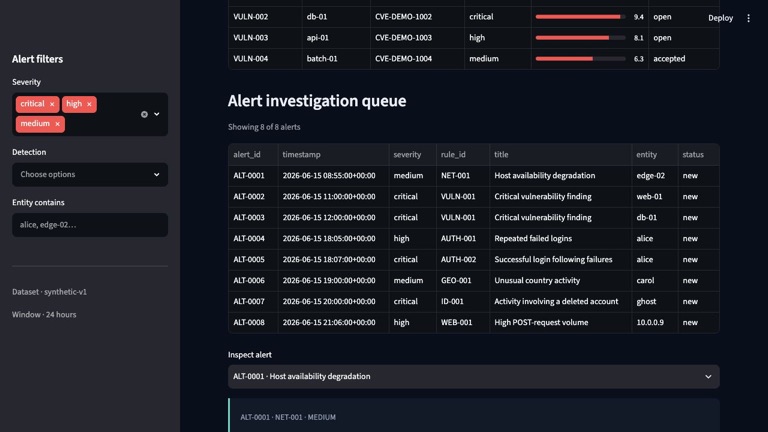
Investigation views include rule identifiers, severities, entities, timestamps, status, evidence, and rule-specific guidance.
Lessons
What carries into the next system.
A SOC dashboard is more useful when each alert exposes the rule, event, entity, and analyst guidance behind it.
Selected artifacts
Additional views of the working system.
The investigation queue ties each synthetic alert to its rule, entity, timestamp, status, and supporting detail.